
Particle analysis (Berlin, 37°C...)
Inhomogeneous, granular material is encountered in many scientific disciplines. For instance, think about living tissue and bacteria cultures in biology, or polycrystals and composite materials in material science. As an example, look at the following micrograph, which was acquired by a scanning electron microscope and shows a top-view of upright standing GaN nanowires on a Si substrate. The horizontal size of this micrograph is 5 µm, i.e., about 10 times smaller than the diameter of an average human hair. The nanowires are really quite small: much more tiny than bacteria, they are similar in size to common virii.
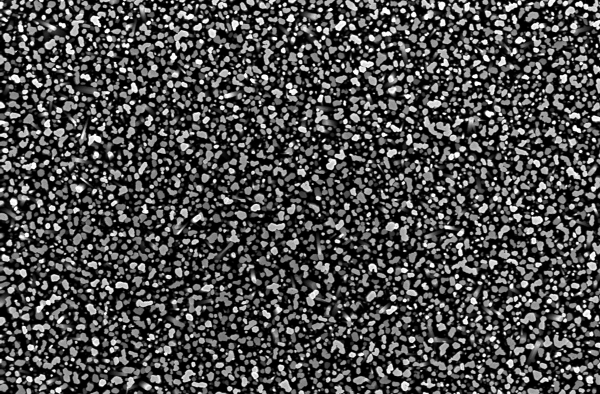
Quite some bed of nails, huh? As you can easily see, all of these nanowires are individual entities, quite different in size and shape from their neighbors. It is an interesting, but very cumbersome task to study the properties of individual nanowires. Fortunately, one is often interested in the properties of a nanowire ensemble, thus averaging over the response of the individuals consituting the entire population.
To correlate this average to the geometrical reality of the given ensemble, one desires to obtain an impression on the actual distribution of sizes in this ensemble. As a physicist, I'd like to simplify that even further, and get a histogram of the size (i.e., area) of the individual entities represented by a disk of the same area (the eqivalent disk).
There are two open-source programs available which are capable of performing this task in a straightforward way: Gwyddion and ImageJ.
In Gwyddion, you load the image, define its physical dimensions, set a threshold either by height or watershed (e.g., /Data Process/Grains/Mark by Threshold), and then plot or export the data you are interested in by selecting /Data Process/Grains/Distributions and checking "Equivalent Disc Radius" in the Area menu. The result using a height threshold of 25%:
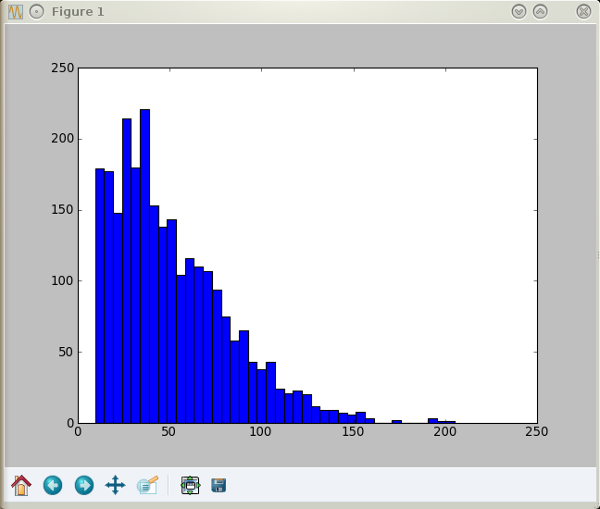
This plot was obtained in a terminal by the following set of commands:
ipython -pylab
a=loadtxt('gwyddion.dat')
b=2e9*a
hist(b,40)
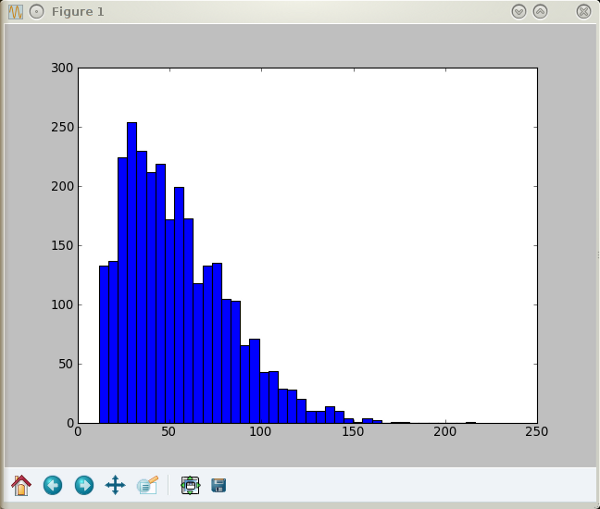
To do the same using ImageJ, you first load the image and draw a line across it. To set the scale, you enter the length of the line in /Analyze/Set Scale. To set a threshold, you might use the fully automated way (/Process/Binary/Make Binary) or do it manually (/Image/Adjust/Threshold). Then, use the '/Analyze/Analyze Particles' dialog. The advantage over Gwyddion is that you can set limits on both the minimum and maximum particle size, which I've used here to exclude diameters less than 10 nm. Apart from the smaller sizes, the result is quite similar:
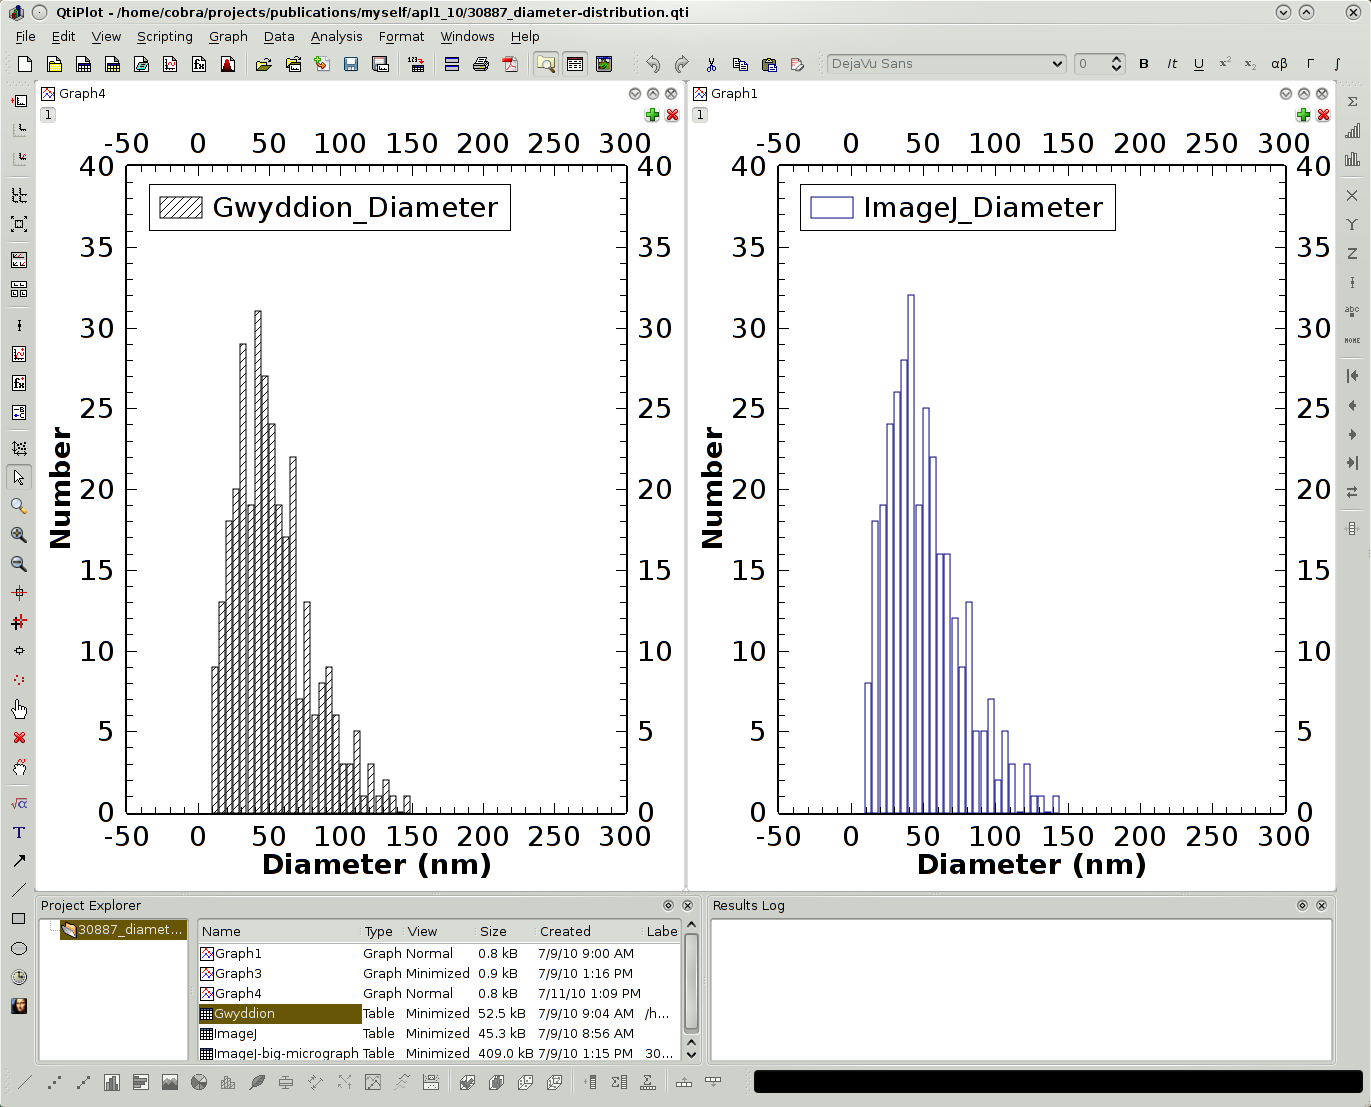
For plotting the results, qtiplot may be used as a graphically oriented alternative. I've analyzed another (smaller) scanning electron micrograph with both programs and obtained the following histograms:
You see that I'm working despite the suffocating heat. What else could I do? *Teilnamslosdalieg* ist too boring on a long term 😉